Add subtitle to graph
Introduction
We will add new subtitle to this graph.
Procedure
To add a new subtitle in ggplot2, we use the ggtitle(label=”…”, subtitle=”…”) command.
Code
library(ggplot2)
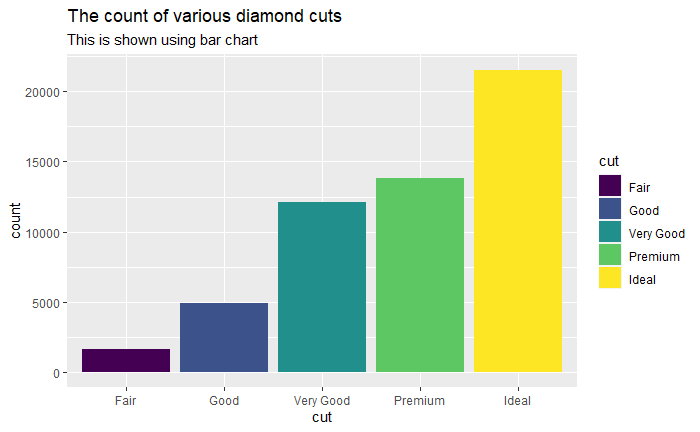
# label is for title, subtitle is for subtitle
ggplot(data = ggplot2::diamonds) + geom_bar(mapping = aes(x = cut, fill=cut)) + ggtitle(label = "The count of various diamond cuts", subtitle = "This is shown using bar chart")The output of code is:
Conclusion
Thus we have successfully added subtitle to graph.
References
- https://r4ds.had.co.nz/
- https://www.datanovia.com/en/blog/ggplot-title-subtitle-and-caption/